GC-MS, GC-FID and HPLC
Three abbreviations appear often on the certificate of analysis of an extract (CoA, the document that reports the measurements of one batch): GC-MS, GC-FID, HPLC. All three are chromatography methods. Chromatography separates a mixture into its components. The three do different jobs. GC-MS tells you what a component is. GC-FID measures how much of each volatile component is present. HPLC measures how much of each non-volatile active compound is present. What a percentage on the certificate means depends on which method produced it.
What does chromatography do?
Chromatography separates a mixture into its components and draws each component as a peak. The sample passes through a long, narrow column (a separation tube). Each component moves through the column at a different speed and exits at a different time. A detector at the outlet (the part that senses what leaves the column) records each component as a peak. The exit time of the peak gives a clue to which substance it is. The area of the peak tells how much of it there is.
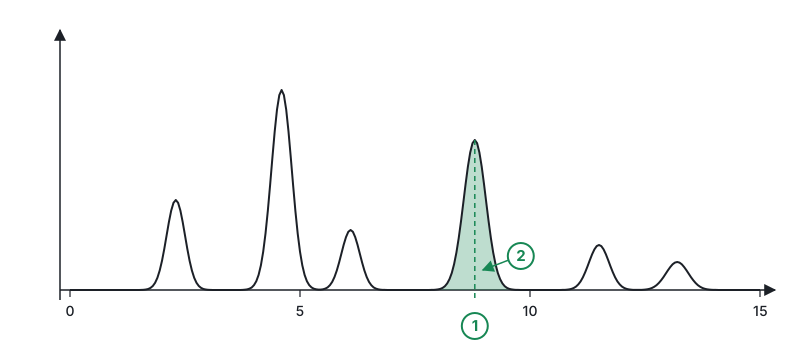
Gas chromatography (GC) is for volatile substances. The sample is heated, vaporized and carried into the column by a gas. Essential oils, the volatile fraction of a CO₂ extract (its aromatic, volatile part) and terpenes (the family of molecules behind pine, citrus and lavender scents) are measured this way. In essential oil analysis, GC does the separating. For identification, a mass spectrometer (a second instrument that identifies each component) is usually added to it [1].
Liquid chromatography (HPLC) is for non-volatile substances. The sample is dissolved in a solvent and pumped through the column under pressure. Substances that do not vaporize, or that break down when heated, are measured this way: piperine, gingerols, capsaicinoids, carnosic acid.
The first part of the abbreviation names the separation method, GC or HPLC. For GC, the second part names the detector. MS identifies, FID quantifies. On a certificate, HPLC is usually written on its own.
What does GC-MS prove?
GC-MS proves the identity of a component. The mass spectrometer (MS) breaks each peak into fragments and records the fragmentation pattern. This pattern is like the fingerprint of the molecule. The instrument compares the pattern with a library (a list of recorded patterns) and reports the closest match. The peak list on a certificate is written this way: "linalool", "limonene", "carvacrol".
Identity is given by two criteria: the library match and the exit time of the peak. Library patterns were recorded under different conditions, and similar terpenes can give the same pattern. An essential oil study therefore does not treat the library as the only criterion and assigns identity together with the retention index [2]. The retention index is the exit time of a peak converted into a comparable number that does not depend on the instrument. It allows comparison between laboratories and is the complementary information for confirming identity [3]. A detailed report lists the retention index next to the component name.
GC-MS does not prove quantity. The MS detector responds differently to each substance. A percentage written from MS peak areas is therefore an approximate value. The short rule is this: GC-MS identifies, GC-FID quantifies.
What does GC-FID prove?
GC-FID proves the quantity of volatile components. The flame ionization detector (FID) burns the substance leaving the column in a hydrogen flame and measures the current that forms. The response varies little from one substance to another. It is related to the heat of combustion and can be predicted from the molecular formula [4], [5]. In MS the difference is large. This is why FID peak area is close to the true proportion and MS peak area is not.
The percentage on an essential oil certificate is usually area percent. The areas of all peaks are added up, and each peak is written as a percentage of the total. This calculation assumes that every substance gives the same response. The result is close to the true proportion, not equal to it. In essential oil measurement there are several routes, from area percent to a true amount found by calibration (setting the instrument with known amounts). Each route has its own field and its own limits [6]. Area percent is fast and is enough to compare batches of the same oil. Weight percent (how many grams in 100 grams) needs a reference substance (a pure comparison substance of known amount) or an internal standard (a comparison substance added to the sample in a known amount). Formulation calculations use weight percent.
Two notations appear on certificates. "Area %" or "% (GC-FID, normalised)" is area percent; normalised means the total has been scaled to 100. "w/w %" or "g/100 g" is weight percent. The two can give different numbers for the same oil. Essential oil standards (ISO) give component ranges by GC [7]. On a certificate, the range and the method are read together.
Fatty acids are also measured by GC-FID. The "fatty acid profile" line of a fixed oil or seed oil extract comes from this method. Fatty acids are not volatile. Before measurement they are chemically converted into a form that can vaporize (methyl esters, FAME). The result is written as a percentage of total fatty acids, not as a weight percent of the product.
What does HPLC prove?
HPLC proves the weight percent of a non-volatile active compound. The instrument is set with a pure reference substance of known amount. The peak of the sample is compared with it, and the result is a weight percent (the true content). The detector is usually ultraviolet (UV) light absorption; DAD is a member of the same family. A line such as "Piperine 27.4% (HPLC)" is a measured weight percent, not an area percent. The figure is an example.
Official HPLC methods exist for commonly bought extracts. For ginger there are United States Pharmacopeia (USP) and ISO methods [8]. For turmeric, the AOAC method (international association for analytical methods) measures the three curcuminoids separately [9].
A certificate line gives either a single component or the total. HPLC separates related compounds into separate peaks. In chili, the capsaicinoids are a family, and the two main members are capsaicin and dihydrocapsaicin [10]. The "total capsaicinoids" line and the "capsaicin" line are not the same number. The same question applies to curcuminoids, gingerols and tocopherols. For examples, see piperine, gingerols, capsaicinoids, carnosic acid and tocopherols.
What does none of them prove?
Chromatography does not prove origin. It tells which molecule a peak is, not where it came from. For origin, the ratio of the right- and left-handed forms of the same molecule (enantiomers) is examined. This is a separate test, done by GC with a special column that can separate the two forms (chiral GC) [7].
It does not prove contaminants. Heavy metals, pesticides and microbes are measured with separate instruments and separate methods. On a certificate they are separate lines. Residual solvents are also measured by a separate GC method, from the vapour above the sample (headspace). What can remain is explained on a separate page: solvent residues.
How is it read on the certificate?
| Method | What for | What appears on the certificate | What it does not say |
|---|---|---|---|
| GC-MS | identity of volatile components | peak list, library match, retention index | true quantity, origin |
| GC-FID | quantity of volatile components | area percent, or weight percent with a reference substance | identity on its own, non-volatile substances |
| HPLC (UV/DAD) | quantity of a non-volatile active compound | weight percent with a reference substance, component by component | volatile components, origin |
Specification and measurement are kept apart. The technical data sheet (TDS) gives the limit. The certificate gives the result of that batch on the day of measurement. The difference between the three documents is explained on a separate page: TDS, SDS, CoA.
References
- Marriott P., Shellie R. et al. (2001). Gas chromatographic technologies for the analysis of essential oils. Journal of Chromatography A. https://doi.org/10.1016/s0021-9673(01)01314-0
- Oprean R., Tamas M. et al. (1998). Essential oils analysis. I. Evaluation of essential oils composition using both GC and MS fingerprints. Journal of Pharmaceutical and Biomedical Analysis. https://doi.org/10.1016/s0731-7085(98)00283-0
- Zellner B., Bicchi C. et al. (2008). Linear retention indices in gas chromatographic analysis: a review. Flavour and Fragrance Journal. https://doi.org/10.1002/ffj.1887
- Tissot E., Rochat S. et al. (2012). Rapid GC-FID quantification technique without authentic samples using predicted response factors. Flavour and Fragrance Journal. https://doi.org/10.1002/ffj.3098
- de Saint Laumer J., Cicchetti E. et al. (2010). Quantification in Gas Chromatography: Prediction of Flame Ionization Detector Response Factors from Combustion Enthalpies and Molecular Structures. Analytical Chemistry. https://doi.org/10.1021/ac1006574
- Bicchi C., Liberto E. et al. (2008). Quantitative analysis of essential oils: a complex task. Flavour and Fragrance Journal. https://doi.org/10.1002/ffj.1905
- Linge K., Cooper L. et al. (2024). Comparison of Approaches for Authentication of Commercial Terpinen-4-ol-type Tea Tree Oils Using Chiral GC/MS. Journal of Agricultural and Food Chemistry. https://doi.org/10.1021/acs.jafc.3c08140
- You H., Ireland B. et al. (2019). Determination of bioactive nonvolatile ginger constituents in dietary supplements by a rapid and economic HPLC method: Analytical method development and single-laboratory validation. Talanta. https://doi.org/10.1016/j.talanta.2018.10.075
- Mudge E., Brown P. (2018). Determination of Curcuminoids in Turmeric Raw Materials and Dietary Supplements by HPLC: Single-Laboratory Validation, First Action 2016.16. Journal of AOAC INTERNATIONAL. https://doi.org/10.5740/jaoacint.17-0111
- González-Zamora A., Sierra-Campos E. et al. (2013). Characterization of Different Capsicum Varieties by Evaluation of Their Capsaicinoids Content by High Performance Liquid Chromatography, Determination of Pungency and Effect of High Temperature. Molecules. https://doi.org/10.3390/molecules181113471